Useful Javascript debugging tips you didn’t know
The Raygun team is made up of a bunch of nerdy folk just like yourself. Occasionally they write about tools they like and thoughts they have about dev-type topics. This week we’ve got Rick, our longboarding-freediving-Swedish speaking front-end dev talking about ‘things you didn’t know about Javascript debugging’.
Knowing your tools can make a major difference when it comes to getting things done. This is a list of small debugging tips you probably didn’t know but soon won’t live without. In this post, most of the tips are for Chrome inspector even though my favourite tips are for Firefox. Many of these tips will work in other inspectors as well.
Quick find your DOM elements.
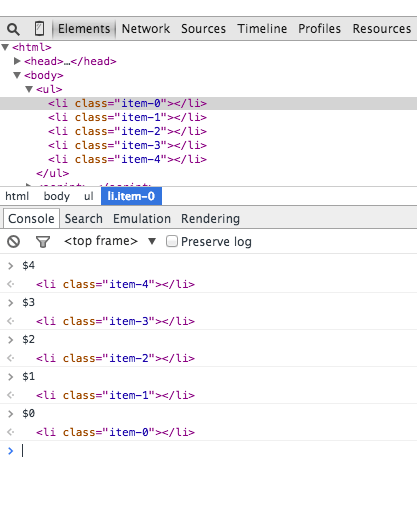
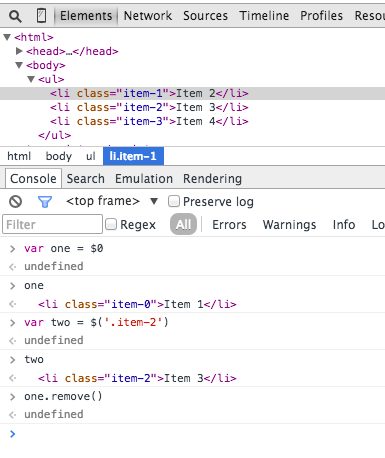
Mark a dom element in the elements panel and use it in your console. Chrome inspector keeps the last 5 elements in its history, so the last marked element will be displayed with $0, second to last marked element $1 and so on.
If you mark following items in order’item-4′, ‘item-3′, ‘item-2′, ‘item-1′, ‘item-0′ then you can access the DOM nodes like this in the console.
Display object as tables
Sometimes it can be a bit messy to view a lot of data with console.log. You can display a list of objects as a table to view complex sets of data more easily.
1 2 3 4 5 6 | var animals = [ { animal: 'Horse', name: 'Henry', age: 43 }, { animal: 'Dog', name: 'Fred', age: 13 }, { animal: 'Cat', name: 'Frodo', age: 18 } ]; console.table(animals); |
Will output…

Get the stack trace for a function
If you’re using a javascript framework you know that it quickly produces a lot of code. Views are created, events are triggering functions and in the end you want to know what caused this function call. Since Javascript is not a very structured language it can sometimes be hard to get an overview of what happened and when. Especially when you jump into someone else’s code. This is when console.trace (or just trace in the console) comes handy.
Imagine you want to see the entire stack trace for the function call funcZ in the car instance on line 33:
1 2 3 4 5 6 7 8 9 10 11 12 13 14 15 16 17 18 19 20 21 22 23 24 25 26 27 28 29 30 31 32 33 34 35 36 | var car; var func1 = function(){ func2(); } var func2 = function(){ func4(); } var func3 = function(){ } var func4 = function(){ car = new Car(); car.funcX(); } var Car = function(){ this.brand = 'volvo'; this.color = 'red'; this.funcX = function(){ this.funcY(); } this.funcY = function(){ this.funcZ(); } this.funcZ = function(){ console.trace('trace car') } } func1(); |
Line 33 will output…
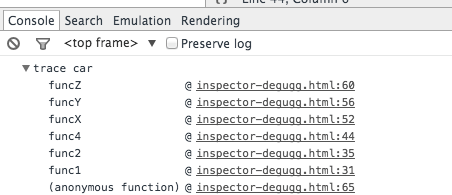
Now we can clearly see that function func1 called func2 which called func4. Func4 created an instance of Car and then called the function car.funcX and so on.
Even though you think you know your script well this can still be quite handy. Let’s say you want to improve your code. Get the trace and your great list of all related functions. Every single one is clickable and you can now go back and fourth between these functions. It’s like a menu of functions just for you.
Quick find a function to debug
Let’s say you want to set a breakpoint in a function. The two most common ways to do that is probably to find the line in your inspector and add a breakpoint. Another way would be to add a debugger in your script. In both of these solutions, you have to click around in your files to find the particular line you want to debug.
What is probably less common is to use the console. Use debug(funcName) in the console and the script will stop when it reaches the function you passed in. It’s quick but the downside is it doesn’t work on private or anonymous functions. But if that’s not the case it’s probably the fastest way to find a function to debug. Note that there’s a function called console.debug which is not the same thing.
1 2 3 4 5 6 7 8 9 10 11 12 | var func1 = function(){ func2(); }; var Car = function(){ this.funcX = function(){ this.funcY(); } this.funcY = function(){ this.funcZ(); } } var car = new Car(); |
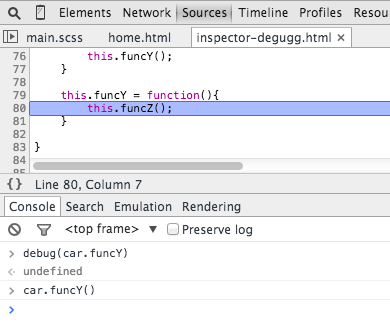
Type debug(car.funcY) in the console and the script will stop in debug mode when it gets a function call to car.funcY.
Black box scripts that are NOT relevant
Today we often have a few libraries and frameworks on our web apps. Most of them are well tested and relatively bug free. But we still debug our own scripts and the debugger still steps in to all those files that have no relevance for this debugging task. The solution is to black box the script you don’t need to debug. This could also include your own scripts. Read more about black boxing in my previous article javascript-debugging-with-black-box.
Find the important things in complex debugging
In more complex debugging we sometimes want to output many lines. One thing you can do to keep a better structure of your outputs is to use more console functions like: Console.log, console.debug, console.warn, console.info, console.error and so on. You can then filter them in your inspector. But sometimes this is not really what you want. It’s now that YOU can get creative and style your messages. Use CSS and make your own structured console messages.
1 2 3 4 5 6 7 8 | console.todo = function( msg){ console.log( '%c %s %s %s ', 'color: yellow; background-color: black;', '--', msg, '--'); } console.important = function( msg){ console.log( '%c%s %s %s', 'color: brown; font-weight: bold; text-decoration: underline;', '--', msg, '--'); } console.todo("This is something that's need to be fixed"); console.important('This is an important message'); |
will output…
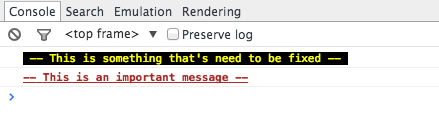
In the console.log() you can for example set %s for a string, %i for integers and %c for custom style. You can probably find better ways to use this. If you use a single page framework you maybe want to have one style for view message and another for models, collections, controllers and so on. Maybe also name the shorter like wlog, clog and mlog. It’s time to use your own imagination.
Watch specific function calls and it’s arguments
In the chrome console you can keep an eye on specific functions. Every time the function is called it will be logged with the values that was passed in.
1 2 3 | var func1 = function(x,y,z){ }; |
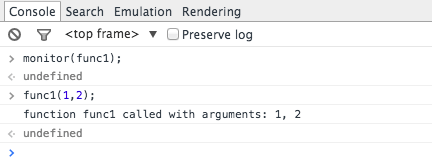
This is a great way to see what arguments are passed into a function. But I must say it would be good if the console could tell how many arguments were expected. In the above example func1 expect 3 arguments but only 2 is passed in. If that’s not handled in the code it could lead to a possible bug.
Quickly access elements in the console
A faster way to do a querySelector in the console is with the dollar sign. $(‘css-selector’) will return the first match of CSS selector. $$(‘css-selector’) will return all of them. If you are using an element more than once it is worth it to save it as a variable.
Post man is great but Firefox is faster
Many developers are using Postman to play around with ajax requests. Postman is great but I must say it’s a bit annoying to open up a new browser window, write new request objects and then test them. Sometimes it’s easier to use your browser. When you do so you no longer need to worry about authentication cookies if you are sending to a password secure page. This is how you would edit and resend requests in firefox.
Open up the inspector and go to the network tab. Right click on the desired request and choose Edit and Resend. Now you can change anything you want. Change the header and edit your parameters and the simply hit resend.
Below I resent a request twice with different properties.

Edit ajax request
Having said that postman is still great and has other benefits.
Summary
This article may not change the world but I hope those small tips and tricks will make your coding day easier and more fun. If you like to speed up your workflow I can also recommend you to read:
- Speed up your markup with zen coding emmet
- Emmet and css the forgotten part
- Chrome command line api
- Chrome developer tools tips and tricks
- Firefox edit and resend a request
Want to make Javascript debugging even easier with your own apps? Raygun has a free trial available and works with Javascript. Get started today and start blasting away software errors in record time!
Share this post
'javascript' 카테고리의 다른 글
| a 태그 클릭시 동적으로class 추가 하기 (0) | 2015.09.30 |
|---|---|
| 자바스크립트 복잡한 함수 스택 검사하는 방법 (0) | 2015.09.30 |
| 최신 배열생성 법과 인스턴스 생성시 문법 (0) | 2015.09.25 |
| 자바스크림트 배열 안에 배열을 넣을때 (0) | 2015.09.25 |
| 자바 스크립트에서 키와 value를 이용한 for문 (0) | 2015.09.25 |


