console.trace('trace car')
Get the stack trace for a function
If you’re using a javascript framework you know that it quickly produces a lot of code. Views are created, events are triggering functions and in the end you want to know what caused this function call. Since Javascript is not a very structured language it can sometimes be hard to get an overview of what happened and when. Especially when you jump into someone else’s code. This is when console.trace (or just trace in the console) comes handy.
Imagine you want to see the entire stack trace for the function call funcZ in the car instance on line 33:
1 2 3 4 5 6 7 8 9 10 11 12 13 14 15 16 17 18 19 20 21 22 23 24 25 26 27 28 29 30 31 32 33 34 35 36 | var car; var func1 = function(){ func2(); } var func2 = function(){ func4(); } var func3 = function(){ } var func4 = function(){ car = new Car(); car.funcX(); } var Car = function(){ this.brand = 'volvo'; this.color = 'red'; this.funcX = function(){ this.funcY(); } this.funcY = function(){ this.funcZ(); } this.funcZ = function(){ console.trace('trace car') } } func1(); |
Line 33 will output…
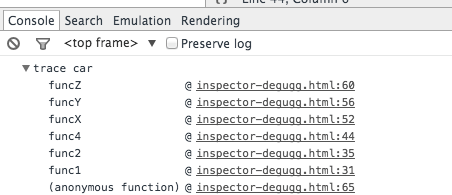
Now we can clearly see that function func1 called func2 which called func4. Func4 created an instance of Car and then called the function car.funcX and so on.
Even though you think you know your script well this can still be quite handy. Let’s say you want to improve your code. Get the trace and your great list of all related functions. Every single one is clickable and you can now go back and fourth between these functions. It’s like a menu of functions just for you.
'javascript' 카테고리의 다른 글
| 자바스크립트에서 객체로 생성하는법 (0) | 2015.09.30 |
|---|---|
| a 태그 클릭시 동적으로class 추가 하기 (0) | 2015.09.30 |
| 자바스크립트 크롬 디버깅 쓰는 팁 (0) | 2015.09.30 |
| 최신 배열생성 법과 인스턴스 생성시 문법 (0) | 2015.09.25 |
| 자바스크림트 배열 안에 배열을 넣을때 (0) | 2015.09.25 |


